
Introduction to Machine Learning Using Only NumPy
Table of Content
Understand Machine Learning
Usage of NumPy in Machine Learning Using Python
Create One dimensional Array
Create Two dimensional Array
Create Three dimensional Array
Different ways of Accessing the elements of numpy array
Univariate Analysis in Numpy
Bivariate Analysis in Numpy
Linear Regression using Numpy
Essentialities to Learn Machine Learning With Python
A Glance at the Important Libraries for Python Machine Learning
Scikit-learn
TensorFlow
Pandas
Theano
PyTorch
Matplotlib
Keras
SciPy
Python and Machine Learning using NumPy dives into the core basics of Python machine learning, which is the most well-known programming language. The sound knowledge of NumPy and other important libraries makes Python machine learning an approachable programming language.
Let’s Understand What Machine Learning is
Machine Learning (ML) is the study of computer algorithms that allows a computer to learn automatically from experience. It is predominantly called a branch of Artificial Intelligence (AI). Computer algorithms are used in a variety of applications, such as for the filtration of emails and computer vision, where they are considered quite difficult to develop conventional algorithms to perform the required tasks.
By learning Machine Learning using Python, one can do tasks efficiently with a lot of ease. In the olden days, performing tasks using Python machine learning was very time-consuming, inefficient, and tedious. However, with developments in Python machine learning, we now have various Python libraries, frameworks, and modules that make machine learning using Python one of the most popular programming languages.
Machine learning using Python has replaced many languages in the industry, which forms one of the main reasons, is its vast collection of libraries. Libraries that are used in machine learning using Python are:
NumPy
Scikit-learn
TensorFlow
Pandas
Theano
PyTorch
Matplotlib
Keras
SciPy
Among other important libraries that have been implemented for ML using Python, many library functions usually end up rewriting the code for existing functions. This at times is quite time-consuming. During these times, it becomes quite essential to understand the refinements of using a particular library efficiently. NumPy provides clear nuances for Python machine learning.
Usage of NumPy in Machine Learning Using Python
Understanding and implementing NumPy acts as an outset of data pre-processing. Applying these for important algorithms of machine learning with Python gives hands-on expertise in learning the library NumPy for Python and machine learning.
NumPy is a famous and most used library for Python machine learning. It adds great support for large multi-dimensional arrays and matrix processing along with the help of an extensive collection of high-level mathematical functions that are used while operating on these arrays.
NumPy library is very beneficial for fundamental scientific computations in Python ML. Its usage is especially for linear algebra, Fourier transform, and random number capabilities. TensorFlow is a high-end library that uses NumPy internally for the proper direction of Tensors. Moreover, NumPy forms the foundation of Machine Learning using Python stack.
Create One dimensional Array
# Loading the numpy Library
import numpy as my_numpy

# Alternatively you may load the numpy library without assigning a alias like this
import numpy

# if loaded without alias you will call its class, functions,etc without refering the alias
# For ease of referencing, its advisable to provide a alias while importing a library
Figure 1 : Alias for referencing a module or package in python
# lets create a array called my_array_as_row in which we arrange elements as Row's
my_array_as_row = my_numpy.array ([1, 2, 3])

#check the content of this numpy array using print/object name/variable explorer in editor(spider)
print(my_array_as_row)
Out : [1 2 3]

my_array_as_row
Out : array([1, 2, 3])
Create Two dimensional Array
# lets create a array called my_array_as_column in which we arrange elements as Columns's
my_array_as_column = my_numpy.array ([[1], [2], [3]])

print(my_array_as_column)
Out :
[[1]
 [2]
 [3]]

my_array_as_column
Out :
array([[1],
       [2],
       [3]])

# lets create a array called my_array with a 3 rows and 3 columns
my_array = my_numpy.array([[10,20,30],[100,200,300],[1000,2000,3000]])
Create Three dimensional Array
# 3 sets of 4 rows and 4 columns initialized with 0
my_array_3d = my_numpy.zeros((3,4,4))

# add data to the 3D Array
my_array_3d[0,]=[[10,20,30,40],[50,60,70,80],[110,120,130,140],[150,160,170,180]]
my_array_3d[1,]=[[100,200,300,400],[500,600,700,800],[1100,1200,1300,1400],[1500,1600,1700,1800]]
my_array_3d[2,]=[[1000,2000,3000,4000],[5000,6000,7000,8000],[11000,12000,13000,14000],[15000,16000,17000,18000]]

# lets check all the arrays
my_array_as_row.shape
Out : (3,)

type(my_array_as_row)
Out : numpy.ndarray

my_array_as_row.dtype
Out : dtype('int32')

my_array_as_row.ndim
Out : 1

my_array_as_column.shape
Out : (3, 1)

type(my_array_as_column)
Out : numpy.ndarray

my_array_as_column.dtype
Out : dtype('int32')

my_array_as_column.ndim
Out : 2

my_array.shape
Out : (3, 3)

type(my_array)
Out : numpy.ndarray

my_array.dtype
Out : dtype('int32')

my_array.ndim
Out : 2

my_array_3d.shape
Out : (3, 4, 4)

type(my_array_3d)
Out : numpy.ndarray

my_array_3d.dtype
Out : dtype('float64')

my_array_3d.ndim
Out : 3

# if the 3d array is required in int32 then do the following
my_array_3d_int32 = my_numpy.int32(my_numpy.zeros((3,4,4)))

my_array_3d_int32[0,]=[[10,20,30,40],[50,60,70,80],[110,120,130,140],[150,160,170,180]]
my_array_3d_int32[1,]=[[100,200,300,400],[500,600,700,800],[1100,1200,1300,1400],[1500,1600,1700,1800]]
my_array_3d_int32[2,]=[[1000,2000,3000,4000],[5000,6000,7000,8000],[11000,12000,13000,14000],[15000,16000,17000,18000]]

my_array_3d_int32.shape
Out : (3, 4, 4)

type(my_array_3d_int32)
Out : numpy.ndarray

my_array_3d_int32.dtype
Out : dtype('int32')

my_array_3d_int32.ndim
Out : 3
Figure 2 : A graphical representation of array structure - 1 D, 2 D and 3 D
Different ways of Accessing the elements of numpy array
# we are not allocating the selected elements onto any other variable
# we are just selecting and printing it into the console

# selecting and printing the 1st element of the row array
# index in python starts from 0 as against R where is starts from 1
# To access a specific element the index will be perceived location - 1
# So to access 1st element, 1 - 1 = 0
# To access 2nd element, 2 - 1 = 1
print(my_array_as_row[0])
Out : 1

# access the 3rd element of array with only rows
print(my_array_as_row[2])
Out : 3


# access the 3rd element of array with columns
# here we need to give the column index as 1st -1 = 0th column
print(my_array_as_column[2,0])
Out : 3

# access the 2nd element of the 2nd row in the 2dimensional array
# again subtract 1 from perceived location
# so to access 2nd row, 2nd column, pass the index as {2-1 = 1,2-1 = 1}
print(my_array[1,1])
Out : 200

# you can access the elements using the negative index
# so if you have 3 elements in the array
# access first by calling -3
# access second by calling -2
# access third by calling -1
print(my_array_as_row[-3])
Out : 1

print(my_array_as_row[-2])
Out : 2

print(my_array_as_row[-1])
Out : 3

# access elements of 3 dimensional array
# the order would be (set,row.column)
# refer to figure 2 for clarity
# access the 3rd row, 3rd column of 1st set
print(my_array_3d[0,2,2])
Out : 130.0

# access the 2nd row, 4th column of 3rd set
print(my_array_3d[2,1,3])
Out : 8000.0
Univariate Analysis in Numpy
A substantial part of machine learning begins with univariate analysis. If we were using a Pandas module, along with skLearn, this would have been pretty straight forward. But as we know the power of numpy is in its simplicity, advantages of virtualization, indexing and broadcast features. Numpy brings us the computational advantages of C and Fortran into Python. The compiled mode of array processing is worth mentioning along with the standard usage of Numpy in most of the advanced libraries and Numpy form the basis or somewhere the inspiration or starting point for the evolution of other libraries. We will have a quick look at some of these before we jump into our final numpy implementation for Machine Learning. So we can generically state that Numpy is either at the core of these below mentioned libraries or starting point for their development or may be one of the components. DASK is an open source project which integrates Numpy, Scikit-learn and Pandas. Its used for scaling. CuPy is an open source project using NVIDIA CUDA which is compatible with Numpy. In short its a GPU implementation of Numpy. Infact most of the libraries including PyTorch, Tensorflow, Pandas, BioPython, QuTip, SciPy, OpenCV, Matplotlib, Seaborn, etc have numpy as dependency. So lets get into using numpy for statistics and machine learning.
Lets use the Boston housing data set retrieved from UCI Machine Learning Repository archive. A copy of which is kept here for quick download.
# Import Boston housing data into a numpy array
# load the boston data set
housing_data = my_numpy.loadtxt(fname="C:/Users/Mohan/Desktop/Boston.csv",delimiter=",",skiprows=1)

# alternatively you can use the genfromtext option as well
housing_data = my_numpy.genfromtxt("C:/Users/Mohan/Desktop/Boston.csv", delimiter=",", skip_header=1)

# lets do some univariate analysis using numpy
# this is the standard housing data set where we know there are no NA's so we don't need to treat it
# As we need the summary statistics like min,max,quartiles,median,mean,variance and standard deviation
# lets create a empty numpy array with 8 rows and 14 columns filled with zero's
univariate_housing = my_numpy.zeros((8,14))

# calculating the min values of each column in the data and allocating to the univariate_housing array as first record
univariate_housing[0,]=my_numpy.amin(housing_data,axis=0)

# calculating the max values of each column in the data and allocating to the univariate_housing array as second record
univariate_housing[1,]=my_numpy.amax(housing_data,axis=0)

# calculating the first quartile values of each column in the data and allocating to the univariate_housing array as third record
univariate_housing[2,]=my_numpy.quantile(housing_data,0.25,axis=0)

# calculating the second quartile values of each column in the data and allocating to the univariate_housing array as fourth record
univariate_housing[3,]=my_numpy.quantile(housing_data,0.5,axis=0)

# calculating the third quartile values of each column in the data and allocating to the univariate_housing array as fifth record
univariate_housing[4,]=my_numpy.quantile(housing_data,0.75,axis=0)

# We wont be computing the median as the 2nd quartile is already computed
# we have the median method which will give the same output as the quantile with 0.5
# calculating the mean of each column in the data and allocating to the univariate_housing array as sixth record
univariate_housing[5,]=my_numpy.mean(housing_data,axis=0)

# calculating the variance of each column in the data and allocating to the univariate_housing array as seventh record
univariate_housing[6,]=my_numpy.var(housing_data,axis=0)

# calculating the standard deviation of each column in the data and allocating to the univariate_housing array as eighth record
univariate_housing[7,]=my_numpy.std(housing_data,axis=0)

# Have a look at the numpy array with all the statistical parameters
univariate_housing
Bivariate Analysis using Numpy
# lets do some bivariate analysis using numpy
# we will compute the correlation of all variables w.r.t each other

cor_grid = my_numpy.corrcoef(housing_data,rowvar=False)
Linear Regression using Numpy
# Next we can do a simple ML implementation i.e a linear regression
# the last column i.e MEDV is the dependent variable
# lets create seperate arrays of X and Y
X = housing_data[:,0:13]
Y = housing_data[:,13]


# create a class for a custom linear regression model built using numpy as core
# as the numpy object is used, make sure its universally initiated
# we have designed this assuming a sequence of X's is to be passed
# for single variable passed you will have to handle the input when it is parsed
class my_linear_model(object):

    def __init__(self):
        self.linreg_coefficients = []

    def fit(self,feature,target):
        if len(feature.shape) == 1: feature=self._reshape_feature(feature)

        feature= self._con_cat_ones(feature)
        self.linreg_coefficients = my_numpy.linalg.inv(feature.transpose().dot(feature)).dot(feature.transpose()).dot(target)

    def predict(self,data):
        b0= self.linreg_coefficients[0]
        other_betas = self.linreg_coefficients[1:]
        predictions = b0

        for feature_i, bi in zip(data.transpose(),other_betas): predictions += (bi * feature_i)
        return predictions

    def _reshape_feature(self,feature):
        return feature.reshape(-1,1)

    def _con_cat_ones(self,feature):
        ones = my_numpy.ones(shape=feature.shape[0]).reshape(-1,1)
        return my_numpy.concatenate((ones,feature),1)


# initilize your numpy linear regression model
model = my_linear_model()

# train the model with your data
model.fit(X,Y)

# predict the outcomes, we have not split the data into train/test
Predicted_Y= model.predict(X)

# train the model with only one variable, in this case 1st variable
X_single_feature = X[:,[0]]
model.fit(X_single_feature,Y)

# predict the outcomes for this single variable
Predicted_Y_new= model.predict(X_single_feature)

# calculating the RMSE
my_RMSE=  my_numpy.sqrt(my_numpy.mean((Predicted_Y - Y)**2))
You can essentially work around with numpy and execute anything if the basics are clear. For instance, a electrical engineer may see a network as a switch mechanism with serial and parallel processes having capacitors, cutoffs and fuse. An electronic engineer may see the network as a combination of circuitry with various gates (AND, NOR, OR, XOR and so on). Fundamentally things remain the same. If you want to see the linear regression implementation using sci-kit learn , use this link where a different way of statistically implementing linear regression is articulated.
Essentialities to Learn Machine Learning With Python
Python is usually called the language of choice of developers. Using the application of data analysis and statistical techniques while working helps to understand the algorithms better in ML with Python. Data scientists also use Python for processes that are needed to be integrated with the production environment and web apps.
Python and machine learning blend well. The shorter development time, flexibility, and a combination of consistent syntax make it an adapted way of developing prediction engines and sophisticated models which are well-suited to plug directly into production systems. Using Flask the API's are easy to integrate.
We have an extensive combination of libraries which acts as a major asset for machine learning using Python. A library is defined as the collection of functions and routines, which are available to write in a specific language. The robust combination of libraries can build a simplified option for developers to complete and perform well any complicated tasks, without reworking on thousand's of lines of code. Python machine learning is based on mathematics, statistics, mathematical optimization, and probability.
A Glance at the Important Libraries for Python Machine Learning
Scikit-learn
It is one of the highly popular python machine learning libraries developed by David Cournapeau in the year 2007, working with classical Python and machine learning algorithms. It acts as the main support system for many learning algorithms, which are both supervised and unsupervised. Python machine learning includes linear, logistic regressions, classification, decision trees, dimensionality reduction, k-means, model selection, pre-processing, and clustering.
Scikit-learn builds upon two major basic libraries of Python machine learning, which are NumPy and SciPy. Tasks like ensemble methods, data transformation, and feature selection are quick to implement within a few lines. This tool is sufficient for work at the beginner’s level.
TensorFlow
TensorFlow was initially developed for Google’s internal use by the Google Brain team and was first released in November 2015 under Apache License 2.0. It uses a system of multi-layered nodes in ML with python that are quickly allowed to train, set up, and deploy artificial neural networks which have to train on large datasets. The most interesting aspect of TensorFlow is that while a program is written in Python, one can compile and run it either on CPU or GPU. So, rewriting it again on C++ or CUDA level to run on GPUs.
Pandas
It is quite a popular library that is majorly used for data analysis with support for fast, flexible, and expressive data structures designed to work on both “relational” and “labeled” data. Pandas give an insight into Python machine learning in various high-level data structures. There are inbuilt methods for grouping, combining data, filtering and also for performing time series analysis. Pandas can effortlessly get information from various sources that include Excel, JSON, CSV, SQL databases, and manage the data for performing functionalities on it.
The two types of data structures used by pandas are:
Series (1-dimensional)
DataFrame (2-dimensional)
These two data structures can handle several requirements and use cases from the sectors like science, statistics, social, finance, and of course, analytics and other areas of engineering.
Pandas perform and support many kinds of data like:
Arbitrary matrix data with heterogeneous, homogeneous types of data in the rows and columns.
Data from the SQL table or Excel spread sheet mostly tabular data with columns.
The frequency of time series ordered and unordered data need not be fixed, unlike other libraries and tools.
Robust in handling uneven time-series data.
Theano
Theano is also a good library of Python machine learning. It is quite similar to NumPy and is mostly used for numerical computation. It takes the best advantage of a computer’s GPU, which directly allows making data-intensive calculations up to 100 times faster than while running on the CPU. Theano is a quick library in ML with python that makes it quite valuable for deep learning and various computationally complex tasks.
PyTorch
PyTorch has many types of tools and libraries that are very supportive in machine learning, computer vision, and natural language processing. The PyTorch library is open-source and is built on the Torch library. The PyTorch library is quite easy to learn and use. It can smoothly integrate with the python data science stack even including the NumPy as well. Differentiation between PyTorch and NumPy is quite difficult. PyTorch also gives access for developers to perform various functions on Tensors. It also has a robust framework to create computational graphs, and can also change the runtime. There are many other benefits of PyTorch like multi GPU support, simplified pre-processors, and custom data loaders.
Matplotlib
This is a quite popular Python library highly meant for data visualization. It is mainly used for 2D marks to produce high-quality that are needed for publication like image plots, graphs, and figures in a variety of formats. It also allows a MATLAB-like interface which is exceptionally user-friendly. The library is capable to generate the, plots, histograms and scatter plots, error and bar charts with less coding and works by using the standard GUI toolkits like GTK+, wxPython, Tkinter, or Qt to enable the object-oriented API. There is a module named “pyplot” that makes it easy for programmers as it gives special features like control line styles, font properties, formatting axes, etc.
Keras
Keras is a very popular Machine Learning library for Python and had over 400,000 users as of November 2018. It is basically an open-source library used for neural networks and machine learning. It is a high-level neural networks API capable of running also with the TensorFlow, Theano, CNTK, Microsoft Cognitive Toolkit, PlaidML, R and also run quite efficiency and smoothly on both GPU and CPU as well. Keras makes it easy for ML beginners to build and design a Neural Network like building blocks that include objectives, activation functions, layers and optimizers. Keras additionally have few exclusive features to operate on text and images which come in handy whenever there is need for writing any specific Deep Neural Network code. Not just standard neural networks Keras also allows quick and simplified prototyping and helps in recurrent and convolutional neural networks.
SciPy
It is one of the basic and popular libraries of Python machine learning. It contains different modules for statistics, integration, optimization, and linear algebra. This library acts as the core package that makes up the SciPy stack. It is quite useful while manipulating the images.
The bottom line
By using NumPy and other most important Python libraries, understanding the concepts of Python and machine learning will be easy, and implementing them will be more comfortable from an understanding perspective.
About the Author's:
Ameena bibi
Ameena Bibi is an Alumni of M.V.G.R. College of Engineering with a Bachelors of Technology (Computer Science). A Data Science, Machine Learning, AI enthusiast with more than 5 years of experience in writing informative technical content. An enthusiast in providing concrete details related to Python, Machine Learning, and Data Sciences. Stays up-to-date with the latest Industry advancements and transforms complex technical concepts into compelling stories.
Mohan Rai
Mohan Rai is an Alumni of IIM Bangalore , he has completed his MBA from University of Pune and Bachelor of Science (Statistics) from University of Pune. He is a Certified Data Scientist by EMC.Mohan is a learner and has been enriching his experience throughout his career by exposing himself to several opportunities in the capacity of an Advisor, Consultant and a Business Owner. He has more than 18 years’ experience in the field of Analytics and has worked as an Analytics SME on domains ranging from IT, Banking, Construction, Real Estate, Automobile, Component Manufacturing and Retail. His functional scope covers areas including Training, Research, Sales, Market Research, Sales Planning, and Market Strategy.
Table of Content
- Understand Machine Learning
- Usage of NumPy in Machine Learning Using Python
- Create One dimensional Array
- Create Two dimensional Array
- Create Three dimensional Array
- Different ways of Accessing the elements of numpy array
- Univariate Analysis in Numpy
- Bivariate Analysis in Numpy
- Linear Regression using Numpy
- Essentialities to Learn Machine Learning With Python
- A Glance at the Important Libraries for Python Machine Learning
- Scikit-learn
- TensorFlow
- Pandas
- Theano
- PyTorch
- Matplotlib
- Keras
- SciPy
Python and Machine Learning using NumPy dives into the core basics of Python machine learning, which is the most well-known programming language. The sound knowledge of NumPy and other important libraries makes Python machine learning an approachable programming language.
Let’s Understand What Machine Learning is
Machine Learning (ML) is the study of computer algorithms that allows a computer to learn automatically from experience. It is predominantly called a branch of Artificial Intelligence (AI). Computer algorithms are used in a variety of applications, such as for the filtration of emails and computer vision, where they are considered quite difficult to develop conventional algorithms to perform the required tasks.
By learning Machine Learning using Python, one can do tasks efficiently with a lot of ease. In the olden days, performing tasks using Python machine learning was very time-consuming, inefficient, and tedious. However, with developments in Python machine learning, we now have various Python libraries, frameworks, and modules that make machine learning using Python one of the most popular programming languages.
Machine learning using Python has replaced many languages in the industry, which forms one of the main reasons, is its vast collection of libraries. Libraries that are used in machine learning using Python are:
- NumPy
- Scikit-learn
- TensorFlow
- Pandas
- Theano
- PyTorch
- Matplotlib
- Keras
- SciPy
Among other important libraries that have been implemented for ML using Python, many library functions usually end up rewriting the code for existing functions. This at times is quite time-consuming. During these times, it becomes quite essential to understand the refinements of using a particular library efficiently. NumPy provides clear nuances for Python machine learning.
Usage of NumPy in Machine Learning Using Python
Understanding and implementing NumPy acts as an outset of data pre-processing. Applying these for important algorithms of machine learning with Python gives hands-on expertise in learning the library NumPy for Python and machine learning.
NumPy is a famous and most used library for Python machine learning. It adds great support for large multi-dimensional arrays and matrix processing along with the help of an extensive collection of high-level mathematical functions that are used while operating on these arrays.
NumPy library is very beneficial for fundamental scientific computations in Python ML. Its usage is especially for linear algebra, Fourier transform, and random number capabilities. TensorFlow is a high-end library that uses NumPy internally for the proper direction of Tensors. Moreover, NumPy forms the foundation of Machine Learning using Python stack.
# Loading the numpy Library
import numpy as my_numpy
# Alternatively you may load the numpy library without assigning a alias like this
import numpy
# if loaded without alias you will call its class, functions,etc without refering the alias
# For ease of referencing, its advisable to provide a alias while importing a library
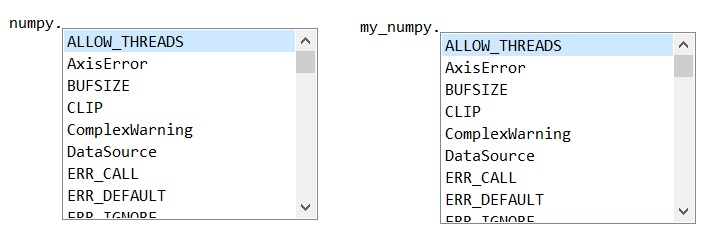
Figure 1 : Alias for referencing a module or package in python
# lets create a array called my_array_as_row in which we arrange elements as Row's
my_array_as_row = my_numpy.array ([1, 2, 3])
#check the content of this numpy array using print/object name/variable explorer in editor(spider)
print(my_array_as_row)
Out : [1 2 3]
my_array_as_row
Out : array([1, 2, 3])
# lets create a array called my_array_as_column in which we arrange elements as Columns's
my_array_as_column = my_numpy.array ([[1], [2], [3]])
print(my_array_as_column)
Out :
[[1]
[2]
[3]]
my_array_as_column
Out :
array([[1],
[2],
[3]])
# lets create a array called my_array with a 3 rows and 3 columns
my_array = my_numpy.array([[10,20,30],[100,200,300],[1000,2000,3000]])
# 3 sets of 4 rows and 4 columns initialized with 0
my_array_3d = my_numpy.zeros((3,4,4))
# add data to the 3D Array
my_array_3d[0,]=[[10,20,30,40],[50,60,70,80],[110,120,130,140],[150,160,170,180]]
my_array_3d[1,]=[[100,200,300,400],[500,600,700,800],[1100,1200,1300,1400],[1500,1600,1700,1800]]
my_array_3d[2,]=[[1000,2000,3000,4000],[5000,6000,7000,8000],[11000,12000,13000,14000],[15000,16000,17000,18000]]
# lets check all the arrays
my_array_as_row.shape
Out : (3,)
type(my_array_as_row)
Out : numpy.ndarray
my_array_as_row.dtype
Out : dtype('int32')
my_array_as_row.ndim
Out : 1
my_array_as_column.shape
Out : (3, 1)
type(my_array_as_column)
Out : numpy.ndarray
my_array_as_column.dtype
Out : dtype('int32')
my_array_as_column.ndim
Out : 2
my_array.shape
Out : (3, 3)
type(my_array)
Out : numpy.ndarray
my_array.dtype
Out : dtype('int32')
my_array.ndim
Out : 2
my_array_3d.shape
Out : (3, 4, 4)
type(my_array_3d)
Out : numpy.ndarray
my_array_3d.dtype
Out : dtype('float64')
my_array_3d.ndim
Out : 3
# if the 3d array is required in int32 then do the following
my_array_3d_int32 = my_numpy.int32(my_numpy.zeros((3,4,4)))
my_array_3d_int32[0,]=[[10,20,30,40],[50,60,70,80],[110,120,130,140],[150,160,170,180]]
my_array_3d_int32[1,]=[[100,200,300,400],[500,600,700,800],[1100,1200,1300,1400],[1500,1600,1700,1800]]
my_array_3d_int32[2,]=[[1000,2000,3000,4000],[5000,6000,7000,8000],[11000,12000,13000,14000],[15000,16000,17000,18000]]
my_array_3d_int32.shape
Out : (3, 4, 4)
type(my_array_3d_int32)
Out : numpy.ndarray
my_array_3d_int32.dtype
Out : dtype('int32')
my_array_3d_int32.ndim
Out : 3
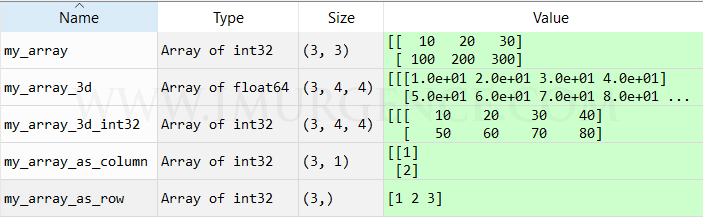
Figure 2 : A graphical representation of array structure - 1 D, 2 D and 3 D
# we are not allocating the selected elements onto any other variable
# we are just selecting and printing it into the console
# selecting and printing the 1st element of the row array
# index in python starts from 0 as against R where is starts from 1
# To access a specific element the index will be perceived location - 1
# So to access 1st element, 1 - 1 = 0
# To access 2nd element, 2 - 1 = 1
print(my_array_as_row[0])
Out : 1
# access the 3rd element of array with only rows
print(my_array_as_row[2])
Out : 3
# access the 3rd element of array with columns
# here we need to give the column index as 1st -1 = 0th column
print(my_array_as_column[2,0])
Out : 3
# access the 2nd element of the 2nd row in the 2dimensional array
# again subtract 1 from perceived location
# so to access 2nd row, 2nd column, pass the index as {2-1 = 1,2-1 = 1}
print(my_array[1,1])
Out : 200
# you can access the elements using the negative index
# so if you have 3 elements in the array
# access first by calling -3
# access second by calling -2
# access third by calling -1
print(my_array_as_row[-3])
Out : 1
print(my_array_as_row[-2])
Out : 2
print(my_array_as_row[-1])
Out : 3
# access elements of 3 dimensional array
# the order would be (set,row.column)
# refer to figure 2 for clarity
# access the 3rd row, 3rd column of 1st set
print(my_array_3d[0,2,2])
Out : 130.0
# access the 2nd row, 4th column of 3rd set
print(my_array_3d[2,1,3])
Out : 8000.0
A substantial part of machine learning begins with univariate analysis. If we were using a Pandas module, along with skLearn, this would have been pretty straight forward. But as we know the power of numpy is in its simplicity, advantages of virtualization, indexing and broadcast features. Numpy brings us the computational advantages of C and Fortran into Python. The compiled mode of array processing is worth mentioning along with the standard usage of Numpy in most of the advanced libraries and Numpy form the basis or somewhere the inspiration or starting point for the evolution of other libraries. We will have a quick look at some of these before we jump into our final numpy implementation for Machine Learning. So we can generically state that Numpy is either at the core of these below mentioned libraries or starting point for their development or may be one of the components. DASK is an open source project which integrates Numpy, Scikit-learn and Pandas. Its used for scaling. CuPy is an open source project using NVIDIA CUDA which is compatible with Numpy. In short its a GPU implementation of Numpy. Infact most of the libraries including PyTorch, Tensorflow, Pandas, BioPython, QuTip, SciPy, OpenCV, Matplotlib, Seaborn, etc have numpy as dependency. So lets get into using numpy for statistics and machine learning.
Lets use the Boston housing data set retrieved from UCI Machine Learning Repository archive. A copy of which is kept here for quick download.
# Import Boston housing data into a numpy array
# load the boston data set
housing_data = my_numpy.loadtxt(fname="C:/Users/Mohan/Desktop/Boston.csv",delimiter=",",skiprows=1)
# alternatively you can use the genfromtext option as well
housing_data = my_numpy.genfromtxt("C:/Users/Mohan/Desktop/Boston.csv", delimiter=",", skip_header=1)
# lets do some univariate analysis using numpy
# this is the standard housing data set where we know there are no NA's so we don't need to treat it
# As we need the summary statistics like min,max,quartiles,median,mean,variance and standard deviation
# lets create a empty numpy array with 8 rows and 14 columns filled with zero's
univariate_housing = my_numpy.zeros((8,14))
# calculating the min values of each column in the data and allocating to the univariate_housing array as first record
univariate_housing[0,]=my_numpy.amin(housing_data,axis=0)
# calculating the max values of each column in the data and allocating to the univariate_housing array as second record
univariate_housing[1,]=my_numpy.amax(housing_data,axis=0)
# calculating the first quartile values of each column in the data and allocating to the univariate_housing array as third record
univariate_housing[2,]=my_numpy.quantile(housing_data,0.25,axis=0)
# calculating the second quartile values of each column in the data and allocating to the univariate_housing array as fourth record
univariate_housing[3,]=my_numpy.quantile(housing_data,0.5,axis=0)
# calculating the third quartile values of each column in the data and allocating to the univariate_housing array as fifth record
univariate_housing[4,]=my_numpy.quantile(housing_data,0.75,axis=0)
# We wont be computing the median as the 2nd quartile is already computed
# we have the median method which will give the same output as the quantile with 0.5
# calculating the mean of each column in the data and allocating to the univariate_housing array as sixth record
univariate_housing[5,]=my_numpy.mean(housing_data,axis=0)
# calculating the variance of each column in the data and allocating to the univariate_housing array as seventh record
univariate_housing[6,]=my_numpy.var(housing_data,axis=0)
# calculating the standard deviation of each column in the data and allocating to the univariate_housing array as eighth record
univariate_housing[7,]=my_numpy.std(housing_data,axis=0)
# Have a look at the numpy array with all the statistical parameters
univariate_housing
# lets do some bivariate analysis using numpy
# we will compute the correlation of all variables w.r.t each other
cor_grid = my_numpy.corrcoef(housing_data,rowvar=False)
# Next we can do a simple ML implementation i.e a linear regression
# the last column i.e MEDV is the dependent variable
# lets create seperate arrays of X and Y
X = housing_data[:,0:13]
Y = housing_data[:,13]
# create a class for a custom linear regression model built using numpy as core
# as the numpy object is used, make sure its universally initiated
# we have designed this assuming a sequence of X's is to be passed
# for single variable passed you will have to handle the input when it is parsed
class my_linear_model(object):
def __init__(self):
self.linreg_coefficients = []
def fit(self,feature,target):
if len(feature.shape) == 1: feature=self._reshape_feature(feature)
feature= self._con_cat_ones(feature)
self.linreg_coefficients = my_numpy.linalg.inv(feature.transpose().dot(feature)).dot(feature.transpose()).dot(target)
def predict(self,data):
b0= self.linreg_coefficients[0]
other_betas = self.linreg_coefficients[1:]
predictions = b0
for feature_i, bi in zip(data.transpose(),other_betas): predictions += (bi * feature_i)
return predictions
def _reshape_feature(self,feature):
return feature.reshape(-1,1)
def _con_cat_ones(self,feature):
ones = my_numpy.ones(shape=feature.shape[0]).reshape(-1,1)
return my_numpy.concatenate((ones,feature),1)
# initilize your numpy linear regression model
model = my_linear_model()
# train the model with your data
model.fit(X,Y)
# predict the outcomes, we have not split the data into train/test
Predicted_Y= model.predict(X)
# train the model with only one variable, in this case 1st variable
X_single_feature = X[:,[0]]
model.fit(X_single_feature,Y)
# predict the outcomes for this single variable
Predicted_Y_new= model.predict(X_single_feature)
# calculating the RMSE
my_RMSE= my_numpy.sqrt(my_numpy.mean((Predicted_Y - Y)**2))
You can essentially work around with numpy and execute anything if the basics are clear. For instance, a electrical engineer may see a network as a switch mechanism with serial and parallel processes having capacitors, cutoffs and fuse. An electronic engineer may see the network as a combination of circuitry with various gates (AND, NOR, OR, XOR and so on). Fundamentally things remain the same. If you want to see the linear regression implementation using sci-kit learn , use this link where a different way of statistically implementing linear regression is articulated.
Python is usually called the language of choice of developers. Using the application of data analysis and statistical techniques while working helps to understand the algorithms better in ML with Python. Data scientists also use Python for processes that are needed to be integrated with the production environment and web apps.
Python and machine learning blend well. The shorter development time, flexibility, and a combination of consistent syntax make it an adapted way of developing prediction engines and sophisticated models which are well-suited to plug directly into production systems. Using Flask the API's are easy to integrate.
We have an extensive combination of libraries which acts as a major asset for machine learning using Python. A library is defined as the collection of functions and routines, which are available to write in a specific language. The robust combination of libraries can build a simplified option for developers to complete and perform well any complicated tasks, without reworking on thousand's of lines of code. Python machine learning is based on mathematics, statistics, mathematical optimization, and probability.
It is one of the highly popular python machine learning libraries developed by David Cournapeau in the year 2007, working with classical Python and machine learning algorithms. It acts as the main support system for many learning algorithms, which are both supervised and unsupervised. Python machine learning includes linear, logistic regressions, classification, decision trees, dimensionality reduction, k-means, model selection, pre-processing, and clustering.
Scikit-learn builds upon two major basic libraries of Python machine learning, which are NumPy and SciPy. Tasks like ensemble methods, data transformation, and feature selection are quick to implement within a few lines. This tool is sufficient for work at the beginner’s level.
TensorFlow was initially developed for Google’s internal use by the Google Brain team and was first released in November 2015 under Apache License 2.0. It uses a system of multi-layered nodes in ML with python that are quickly allowed to train, set up, and deploy artificial neural networks which have to train on large datasets. The most interesting aspect of TensorFlow is that while a program is written in Python, one can compile and run it either on CPU or GPU. So, rewriting it again on C++ or CUDA level to run on GPUs.
It is quite a popular library that is majorly used for data analysis with support for fast, flexible, and expressive data structures designed to work on both “relational” and “labeled” data. Pandas give an insight into Python machine learning in various high-level data structures. There are inbuilt methods for grouping, combining data, filtering and also for performing time series analysis. Pandas can effortlessly get information from various sources that include Excel, JSON, CSV, SQL databases, and manage the data for performing functionalities on it.
The two types of data structures used by pandas are:
- Series (1-dimensional)
- DataFrame (2-dimensional)
These two data structures can handle several requirements and use cases from the sectors like science, statistics, social, finance, and of course, analytics and other areas of engineering.
Pandas perform and support many kinds of data like:
- Arbitrary matrix data with heterogeneous, homogeneous types of data in the rows and columns.
- Data from the SQL table or Excel spread sheet mostly tabular data with columns.
- The frequency of time series ordered and unordered data need not be fixed, unlike other libraries and tools.
- Robust in handling uneven time-series data.
Theano is also a good library of Python machine learning. It is quite similar to NumPy and is mostly used for numerical computation. It takes the best advantage of a computer’s GPU, which directly allows making data-intensive calculations up to 100 times faster than while running on the CPU. Theano is a quick library in ML with python that makes it quite valuable for deep learning and various computationally complex tasks.
PyTorch has many types of tools and libraries that are very supportive in machine learning, computer vision, and natural language processing. The PyTorch library is open-source and is built on the Torch library. The PyTorch library is quite easy to learn and use. It can smoothly integrate with the python data science stack even including the NumPy as well. Differentiation between PyTorch and NumPy is quite difficult. PyTorch also gives access for developers to perform various functions on Tensors. It also has a robust framework to create computational graphs, and can also change the runtime. There are many other benefits of PyTorch like multi GPU support, simplified pre-processors, and custom data loaders.
This is a quite popular Python library highly meant for data visualization. It is mainly used for 2D marks to produce high-quality that are needed for publication like image plots, graphs, and figures in a variety of formats. It also allows a MATLAB-like interface which is exceptionally user-friendly. The library is capable to generate the, plots, histograms and scatter plots, error and bar charts with less coding and works by using the standard GUI toolkits like GTK+, wxPython, Tkinter, or Qt to enable the object-oriented API. There is a module named “pyplot” that makes it easy for programmers as it gives special features like control line styles, font properties, formatting axes, etc.
Keras is a very popular Machine Learning library for Python and had over 400,000 users as of November 2018. It is basically an open-source library used for neural networks and machine learning. It is a high-level neural networks API capable of running also with the TensorFlow, Theano, CNTK, Microsoft Cognitive Toolkit, PlaidML, R and also run quite efficiency and smoothly on both GPU and CPU as well. Keras makes it easy for ML beginners to build and design a Neural Network like building blocks that include objectives, activation functions, layers and optimizers. Keras additionally have few exclusive features to operate on text and images which come in handy whenever there is need for writing any specific Deep Neural Network code. Not just standard neural networks Keras also allows quick and simplified prototyping and helps in recurrent and convolutional neural networks.
It is one of the basic and popular libraries of Python machine learning. It contains different modules for statistics, integration, optimization, and linear algebra. This library acts as the core package that makes up the SciPy stack. It is quite useful while manipulating the images.
The bottom line
By using NumPy and other most important Python libraries, understanding the concepts of Python and machine learning will be easy, and implementing them will be more comfortable from an understanding perspective.
About the Author's:
Write A Public Review