
Table of Content
- What is GridSearchCV ?
- When do you use grid search ?
- Why do we use grid search ?
- GridSearchCV on sklearn's breast cancer dataset
- Grid search using SVM model
- Checking the output
- Why it takes, so much time
- Finding the best score
- Performing grid search on multiple models
- Accessing values in a nested dictionary
- Advantages and Disadvantages of Grid Search
- Conclusion
What is GridSearchCV ?
GridSearchCV is a library available in sklearn pakage. It is most popularly used library for hyperparameter tuning. It helps you loop through various parameters in a model efficiently, while keeping track of your model's accuracy for those parameters.
When do you use grid search ?
After you are done cleaning the data, created visualizations, selected the best features and done various statistical analyses on the data, then comes the time for selecting the model and its parameters. This is the apt time to use grid search to isolate and zero in on the best configuartion for your model.
Why do we use grid search ?
Normally we select a model, set some parameters and check its score (eg: accuracy, precision, etc. for classification model; rmse, mape, etc. for regression model)and keep a record of that score. This helps us search and change the values of parameters. Next again we check its score and keep its record, and we keep doing it over and over again. Then we check the record and select the parameter which gave us the best result, then we do the same thing for other competing models.
Now continuously changing those parameters and keeping track of the result is a very tedious job, but luckily for us, GridSearchCV makes our life easier.
GridSearchCV loops through each parameter one by one while keeping track of all their scores. It even helps us, identify the parameters with the best scores. Note that for all the scores used in grid search, higher the scores better the model.
GridSearchCV on sklearn's breast cancer dataset
In this tutorial, we will learn GridSearchCV for hyperparameter tuning.
Here will be using the breast cancer dataset and fit this data set on various models like SVM, Random forest classifier, Gaussian naive Bayes, etc. We would vary their parameters and select the best model based on the best parameters.
First, we load the breast cancer. Note that this dataset is available to us in dataset library of sklearn pakage so we don't need to download it seperately. You can directly run the code below on your notebook file or editor and you will get a the same output. This is the dataset of Breast Cancer for Women living In Wisconsin USA ,so I will be loading it as BCFWLIWU as attribution.
    from sklearn import datasets
    BCFWLIWU = datasets.load_breast_cancer()
Import various libraries that we will be using
    from sklearn import svm
    from sklearn.ensemble import RandomForestClassifier
    from sklearn.linear_model import LogisticRegression
    from sklearn.naive_bayes import GaussianNB
    from sklearn.tree import DecisionTreeClassifier
    import pandas as pd
    import warnings
    warnings.filterwarnings("ignore")
    # parse the data as a pandas object
    breast_cancer = pd.DataFrame(BCFWLIWU.data,columns=BCFWLIWU.feature_names)
    breast_cancer['target'] = BCFWLIWU.target
    # Check the data set using head
    breast_cancer.head()
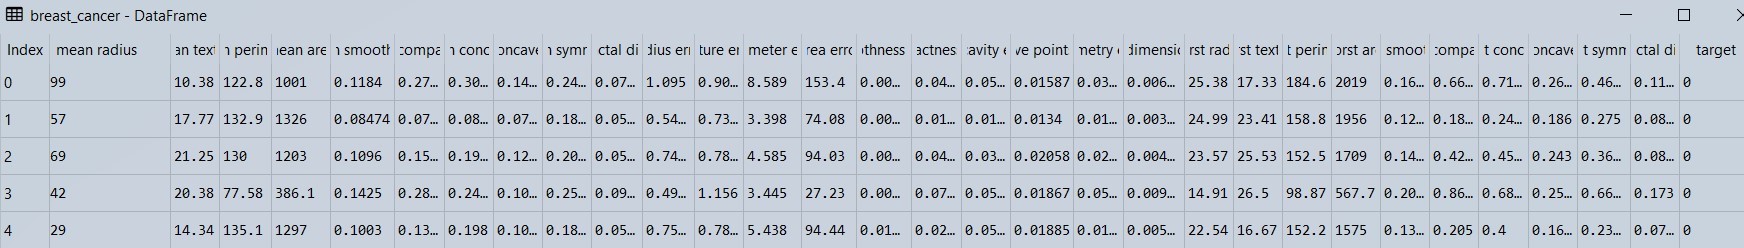
Figure 1 : Displaying description of the breast cancer dataset
    # Check the data set using tail
    breast_cancer.tail()

    BCFWLIWU.target_names
array(['malignant', 'benign'], dtype='
breast_cancer.isna().sum()
mean radius                0
mean texture               0
mean perimeter             0
mean area                  0
mean smoothness            0
mean compactness           0
mean concavity             0
mean concave points        0
mean symmetry              0
mean fractal dimension     0
radius error               0
texture error              0
perimeter error            0
area error                 0
smoothness error           0
compactness error          0
concavity error            0
concave points error       0
symmetry error             0
fractal dimension error    0
worst radius               0
worst texture              0
worst perimeter            0
worst area                 0
worst smoothness           0
worst compactness          0
worst concavity            0
worst concave points       0
worst symmetry             0
worst fractal dimension    0
target                     0
dtype: int64
Here in the target column, we have 'malignant' : 0, 'benign' : 1. The breast cancer dataset is already a clean dataset so we won't do any further cleaning and since here we are only focusing on hyperparameter tuning, we will go ahead with that.
Grid search for SVM model
Lets try using grid search on one model - SVM, then we jump onto multiple models and their parameters.
    from sklearn.model_selection import GridSearchCV
    parameters = [{'C': [1, 10, 100, 1000], 'kernel': ['linear']},
                 {'C': [1, 10, 100, 1000], 'kernel': ['rbf'], 'gamma': [0.0001, 0.001, 0.1, 0.5, 0.9]},
                 {'C': [1, 10, 100, 1000], 'kernel': ['poly']}]
    model_for_grid_search = GridSearchCV(estimator = svm.SVC(),
                               param_grid = parameters,
                               scoring = 'accuracy',
                               cv = 5,
                               n_jobs = -1,
                               #verbose = True
                                        )
    grid_search = model_for_grid_search.fit(BCFWLIWU.data, BCFWLIWU.target)
In GridSearchCV, we get to define various parameters. Here we will check out the most commonly used ones.
The estimator parameter is used to define the model, here the code will be the same as how we define a model.
In the param_grid parameter, we set the parameters for that model, for example, over here the linear and polynomial kernel do not have gamma, only RBF has it.
Similarly, the scoring parameter is used to define the scoring criteria. Default scoring criteria is accuracy score but we can define our own scoring criteria e.g. ‘roc_auc’, ‘precision’, ‘recall’ ,'f1’ etc. for Classification models, and ‘r2’, ‘neg_mean_absolute_error’, ‘neg_root_mean_squared_error’ etc. for Regression models.
cv parameter stands for cross-validation. Here will be using in five-fold cross-validation hence the value of cv = 5. As we have defined cv = 5, we don't need to train_test_split our dataset.
we usually set n_jobs parameter as the number of cores in our CPU, setting it to -1 indicates that all cores will be used parallelly. If you have a quad-core processor, then you can set it to either 1,2,3, or 4 (or (-1:- all cores) or (-2:- all but one core))
more on verbose=True in "Why it takes so much time?" part of blog
Checking the output
Now we can get the result of our grid search using cv_results_ attribute of GridSearchCV.
The Output is not very clear when you look at it, so first will convert it into dataframe and then check the output.
    GridSearch_CV_result = pd.DataFrame(grid_search.cv_results_)
    GridSearsh_CV_result
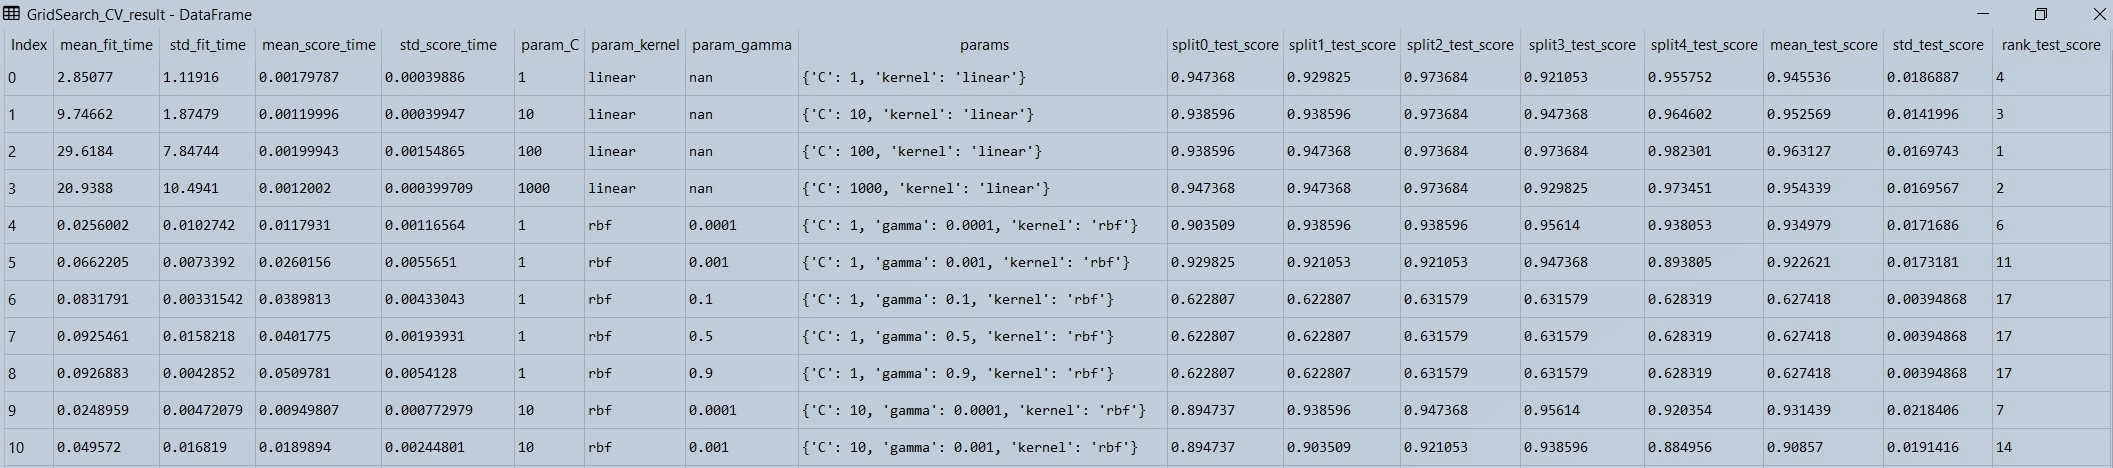
Figure 2 : Displaying the data in the grid search output data frame
Now what grid search does is that it loop's through each and every parameter, that we have defined.
For example, let's see the First row, here the first four columns are time columns. So 1st col is the average time it took for the data to fit in 5 cross-validations, the second column is the standard deviation of those timings, etc. but these 4 columns are not important usually, and are sometimes used when dealing with a very large data set which takes a longer time.
Now comes the important columns, as you can see in the first-row value of c is set as 1, kernel is linear, as there is no gamma parameter in the linear kernel, so it is set as NAN, then come the scores for each cross validation from 0th to 4th split (total 5 splits). Then comes, the mean score of all cross-validations and their standard deviations. Note that these scores are accuracy scores. The last column, rank column is based on the mean_test_score (mean accuracy score). Higher the mean accuracy score better the ranking.
Why it takes, so much time ?
As we already know that grid search loops through each parameter which we have defined, so lets calculate how many times the model is getting executed :-
linear - c=1, --(1)
linear - c=10, --(2)
linear - c=100, --(3)
linear - c=1000, --(4)
same for poly
poly - c=1, --(5)
poly - c=10, --(6)
poly - c=100, --(7)
poly - c=1000, --(8)
now for rbf
rbf - c=1, gamma=0.0001--(9)
rbf - c=10, gamma=0.0001--(10)
rbf - c=100, gamma=0.0001--(11)
rbf - c=1000, gamma=0.0001--(12)
rbf - c=1, gamma=0.001--(13)
rbf - c=10, gamma=0.001--(14)
rbf - c=100, gamma=0.001--(15)
rbf - c=1000, gamma=0.001--(16)
...
rbf - c=1, gamma=0.9--(25)
rbf - c=10, gamma=0.9--(26)
rbf - c=100, gamma=0.9--(27)
rbf - c=1000, gamma=0.9--(28)
You can even count the rows in the GridSearshCV_result dataframe, there will be 28 rows.
Now, for each of these combination of parameters there will be 5 cross validation.
So number of times model gets executed = 28 x 5 = 140
That's the reason it takes so much time as the model gets executed 140 times. You can confirm that by uncommenting verbose = True line in execution, it will give you output similar to figure 3 as below.
What verbose does is, it writes out what is happening while execution is taking place.
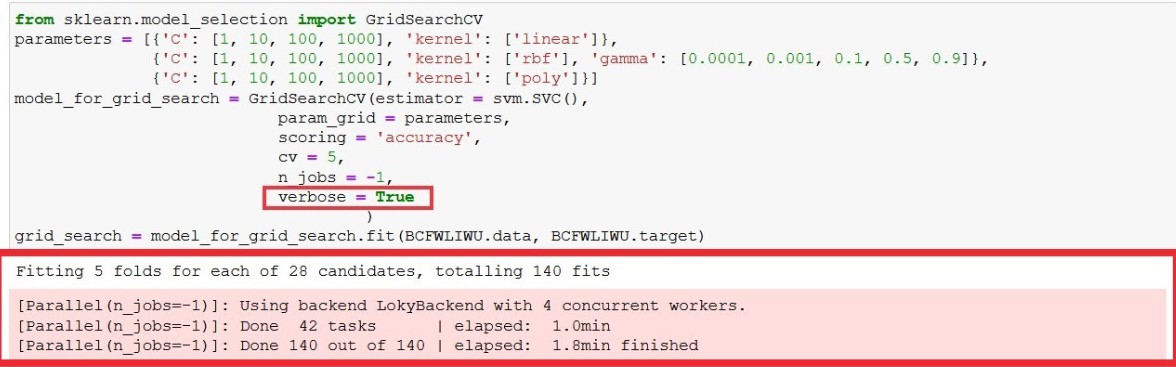
Figure 3 : Viewing grid search execution process by making verbose as true
Finding the best score
A lot of time, we don't need this much information. W only need to know the best parameter and its corresponding score, for that we use best_params_ and best_score_ attributes of GridSearchCV
    model_for_grid_search.best_score_

0.9631268436578171
    model_for_grid_search.best_params_


{'C': 100, 'kernel': 'linear'}
So here as you can see, the best parameters were 'C': 100, 'kernel': 'linear' and its corresponding score was 0.96
Performing grid search on multiple models
In order to to perform hyperparameter tuning on multiple models we need to create a nested dictionary.
    model = {
        'svm': {
            'model': svm.SVC(),
            'parameters' : [{'C': [1, 10, 100, 1000], 'kernel': ['linear']},
                  {'C': [1, 10, 100, 1000], 'kernel': ['rbf'], 'gamma': [0.0001, 0.001, 0.1, 0.5, 0.9]},
                  {'C': [1, 10, 100, 1000], 'kernel': ['poly']}]

        },
        'random_forest': {
            'model': RandomForestClassifier(min_samples_leaf = 20,random_state = 1), ## fixed parameters
            'parameters' : {
                'n_estimators': [1,10,100],
                'max_depth':[20,50]
            }
        },
        'logistic_regression' : {
            'model': LogisticRegression(),
            'parameters': {
                'C': [1,5,10]
            }
        },
        'naive_bayes_gaussian': {
            'model': GaussianNB(),
            'parameters': {}
        },
        'decision_tree': {
            'model': DecisionTreeClassifier(),
            'parameters': {
                'max_depth':[20,50],
                'criterion': ['gini','entropy'],

            }
        }
    }
Note that we can set fixed parameters inside the model which remain same even, when the parameters change.
Accessing values in a dictionary
The keys for this nested dictionary are svm, random_forest, logistic_regression, etc while the value for these keys is another set of dictionary.
model.keys()
dict_keys(['svm', 'random_forest', 'logistic_regression', 'naive_bayes_gaussian', 'decision_tree'])
To access a particular keys value we use the following code : dict_name['key1_name']['key2_name']
model['svm']
{'model': SVC(),
 'parameters': [{'C': [1, 10, 100, 1000], 'kernel': ['linear']},
  {'C': [1, 10, 100, 1000],
   'kernel': ['rbf'],
   'gamma': [0.0001, 0.001, 0.1, 0.5, 0.9]},
  {'C': [1, 10, 100, 1000], 'kernel': ['poly']}]}
As I have said earlier the value for svm key is another dictionary.
To access the parameter key in this dictionary we use the following code.
model['svm']['parameters']
[{'C': [1, 10, 100, 1000], 'kernel': ['linear']},
 {'C': [1, 10, 100, 1000],
  'kernel': ['rbf'],
  'gamma': [0.0001, 0.001, 0.1, 0.5, 0.9]},
 {'C': [1, 10, 100, 1000], 'kernel': ['poly']}]
To access model key we use this code
model['svm']['model']
SVC()
Now we will use For loop to go through each and every model and their parameters.
    for model_name in model.keys():
        print(model[model_name]['model'])
        print(model[model_name]['parameters'])
        print()
SVC()
[{'C': [1, 10, 100, 1000], 'kernel': ['linear']}, {'C': [1, 10, 100, 1000], 'kernel': ['rbf'], 'gamma': [0.0001, 0.001, 0.1, 0.5, 0.9]}, {'C': [1, 10, 100, 1000], 'kernel': ['poly']}]

RandomForestClassifier(min_samples_leaf=20, random_state=1)
{'n_estimators': [1, 10, 100], 'max_depth': [20, 50]}

LogisticRegression()
{'C': [1, 5, 10]}

GaussianNB()
{}

DecisionTreeClassifier()
{'max_depth': [20, 50], 'criterion': ['gini', 'entropy']}
Now using a similar for loop, we will be looping GridSearchCV for each and every model and their parameter.
Here the estimator parameter will contain the models and param_grid parameter will contain its parameter, then we will append the best scores and the best parameters to a list of dictionary, which is then converted to a dataframe.
    best_scores = []

    for model_name in model.keys():
        model_for_grid_search = GridSearchCV(estimator = model[model_name]['model'] ,
                               param_grid = model[model_name]['parameters'],
                               scoring = 'accuracy',
                               cv = 5,
                               n_jobs = -1)
        grid_search = model_for_grid_search.fit(BCFWLIWU.data, BCFWLIWU.target)
        best_scores.append({
            'model': model_name,
            'best score': model_for_grid_search.best_score_,
            'best parameters': model_for_grid_search.best_params_
        })

    best_scores_df = pd.DataFrame(best_scores,columns=['model','best score','best parameters'])
    best_scores_df.sort_values(by = 'best score', ascending = False)
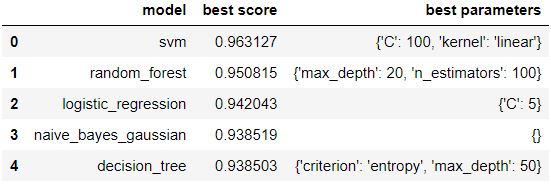 Figure 4 : Model scores with best parameters rendered as data frame
Again it might take some time as grid search require high computational power. Here as you can see in figure 4, the best output was given by SVM (the output is sorted) with its accuracy score as 0.96 and its parameters set to 'C': 100, 'kernel': 'linear'.
Advantages and Disadvantages of Grid Search
Here using this method you can select the best model and it's corresponding parameters. But again, as you might have already noted while running your code, it takes quiet a bit of time to run it and for bigger datasets it might take even longer.
So my suggestion is while using grid search on big datasets, take a sample of that dataset and try running grid search on that sample first, then use the result of that sample on the bigger dataset.
Conclusion
Awesome isn't it? As with grid search, the days of constantly changing parameters and recording their results are behind us and we can finally concentrate on real coding. For a complete end to end implementation of various algorithms for classification using Pipelines, check this article on Understanding Data Pipelines For Machine Learning using Sci-kit learn. Happy coding guyz :)
About the Author's:
Write A Public Review